


In our data-centric environment, organizations have access to various tools to collect, manipulate, and ultimately produce valuable actionable information from raw data. SQL Server is a proven relational database management system that can store and manage business data safely and securely, while Power BI provides enhanced data analytics and visual representation of that data.
When you connect SQL Server to Power BI, you create a seamless pathway between a structured data repository and advanced interactive reporting, giving businesses the ability to make informed, data-driven decisions quickly and efficiently.
1. Why Connect SQL Server to Power BI?

The connections between SQL Server and Power BI create the perfect scenario for data management and analytics. SQL Server can handle greater volumes of transactional data than most organizations encounter, while Power BI can derive from this data, with little effort from the user, visual dashboards and predictive analytics.
Benefits:
- Single access point for data from a secure data source.
- Dashboards are updated in real-time and reports are generated automatically.
- Reduced manual effort with a direct connection from databases.
- Decision-making is improved through interactive analytics.
- Microsoft’s unified ecosystem enhances data governance.
2. Linking SQL Server and Power BI
Connecting SQL Server to Power BI is very simple and can be done in a few steps.
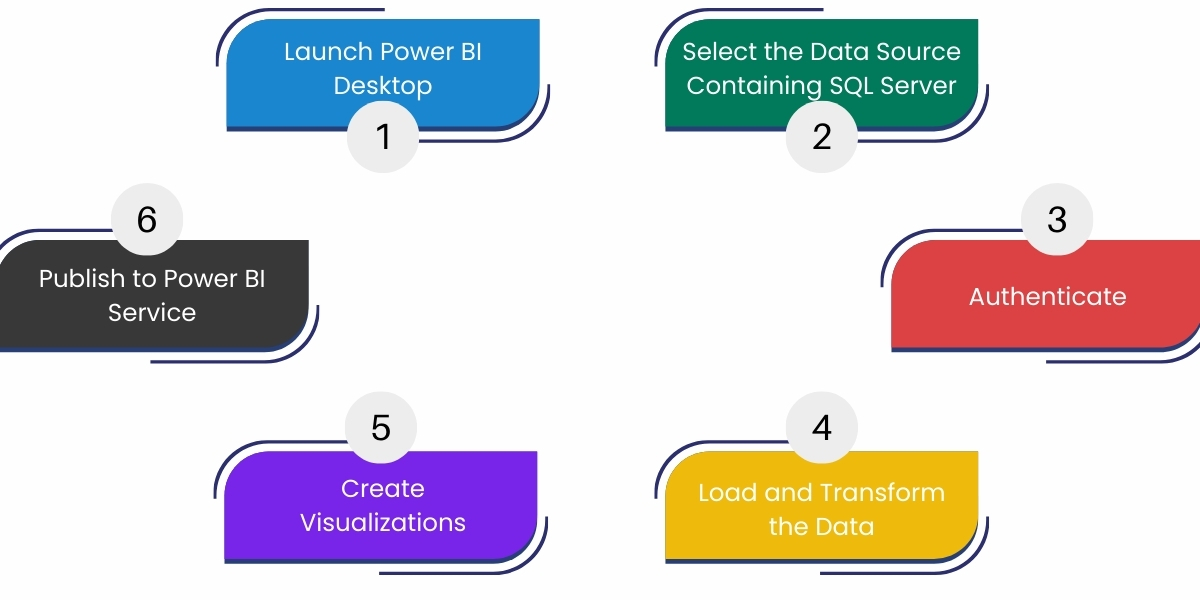
Step 1: Launch Power BI Desktop
First, launch Power BI Desktop, which is the application used to connect, transform, and visualize your data prior to publishing Power BI Service.
Step 2: Select the Data Source Containing SQL Server
- In the main menu, select Home → Get Data → SQL Server.
- Enter your Server Name and Database Name.
- You will have to choose either Import mode or DirectQuery mode.
- Import loads data into Power BI for viewing when offline.
- DirectQuery connects directly to SQL Server to receive real-time updates.
Step 3: Authenticate
Use Windows Authentication or SQL Server Authentication to securely connect to your database.
Step 4: Load and Transform the Data
Once a connection has been established, Power BI’s Power Query Editor allows you to create a clean dataset by filtering, shaping, and transforming the data prior to loading it into your Power BI workspace.
Step 5: Create Visualizations
You can create dashboards and reports using Power BI’s drag-and-drop tools, like charts, graphs and KPIs.
Step 6: Publish to Power BI Service
You can publish your reports to Power BI Service to share insights to a team, schedule refresh times and collaborate with others.
3. Best Practices
Here are some best practices that can help with performance and scalability:
a. Optimize Database Performance.
- Create indexed view for data you frequently query
- Use a stored procedure for complex
- Clean up your unused tables or old data
b. Right Connection Mode
- Use Import Mode for faster visuals and offline anlaysis
- DirectQuery ensures up-to-the-minute reporting for larger datasets
c. Secure Data Access
- Implement role-based access control in SQL Server
- Enable row level security in Power BI to limit sensitive content.
d. Schedule Data Refresh
- Schedule Power BI to refresh, automaticlly, so the reports can consume the latest informed
e. Monitor Performance
- Utilify Power BI’s Performance Analyzer and the Query Store in SQL to look for slow queries and performance issues
4. Advanced Analytics Power BI and SQL Server
Not limited to simple reporting, the integration allows for advanced analytics techniques, including:
- Predictive Analytics – Use Power BI’s AI visuals or integrate with Azure Machine Learning to create forecasting measuring trends etc.
- Real Time Dashboards – SQL Server + Power BI Streaming Datasets allow you store data streams
- Create custom VIsual and DAX – Use DAX (Data Analysis Expressions) creates KPI’s, ratios and more
- Data Modeling – Combine multiple SQL Server tables into relationships for multi-dimensional insights.
5. Typical Applications
a. Sales and Marketing Analytics
Analyze revenue, conversion rates, and campaign activity in real time.
b. Financial Reporting
Generate monthly or quarterly reports directly from SQL Server data, automatically.
c. Operational Oversight
Evaluate supply chain performance, inventory levels, and production efficiency.
d. Customer Insights
Leverage your CRM data from SQL Server alongside the Power BI visuals for enhanced customer behavior insights.
In Closing
The integration of SQL Server and Power BI enables the ability to move data from raw form to meaningful and actionable insights. This integration allows an organization to visualize trends, monitor performance, and make data-driven business decisions — all in real time.
Regardless of whether you are managing a small database or an enterprise level system, this Power BI / SQL Server integration gives you the analytics power you need to remain competitive in the market.
With best practices, connections optimization and data visualizations in Power BI, your SQL Server data can move from static records to a powerful analytics engine for your business success.
Connect SQL Server with Power BI to automate analytics, build real-time dashboards, and turn raw data into actionable business insights with ease.
Frequently Asked Questions
SQL Server and Power BI integration connects a secure, structured SQL database with Power BI’s analytics and visualization tools to turn raw data into interactive dashboards and insights.
Integrating SQL Server with Power BI enables centralized data access, real-time reporting, automated dashboards, reduced manual processes, and faster, data-driven decision-making.
You connect via Power BI Desktop by selecting “Get Data,” choosing SQL Server as the source, entering your server and database names, and choosing Import or DirectQuery mode for real-time or offline analytics.
Import mode loads data into Power BI for quick offline analysis, while DirectQuery fetches data in real time from SQL Server, keeping dashboards constantly updated.
Yes — Power BI can visualize and analyze large datasets efficiently, especially when using optimized SQL queries or DirectQuery mode for real-time insights.
Written by: Empirical Edge Team